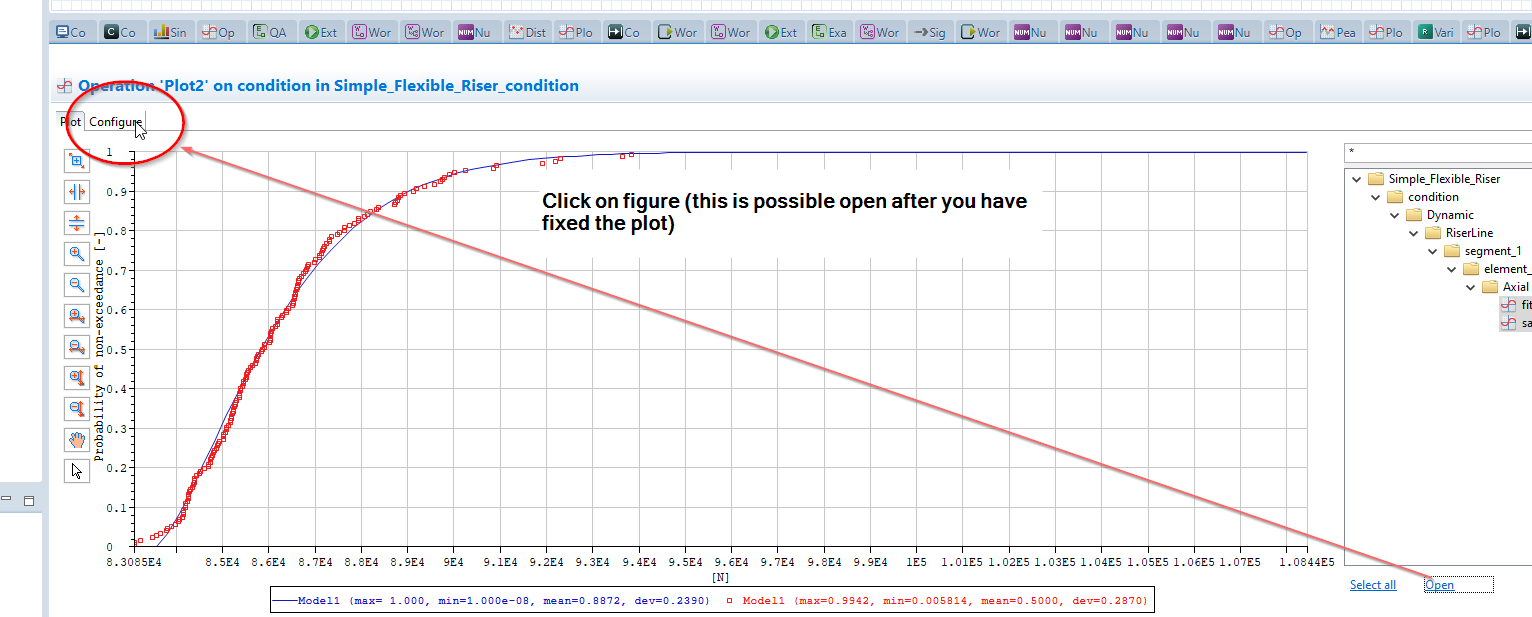
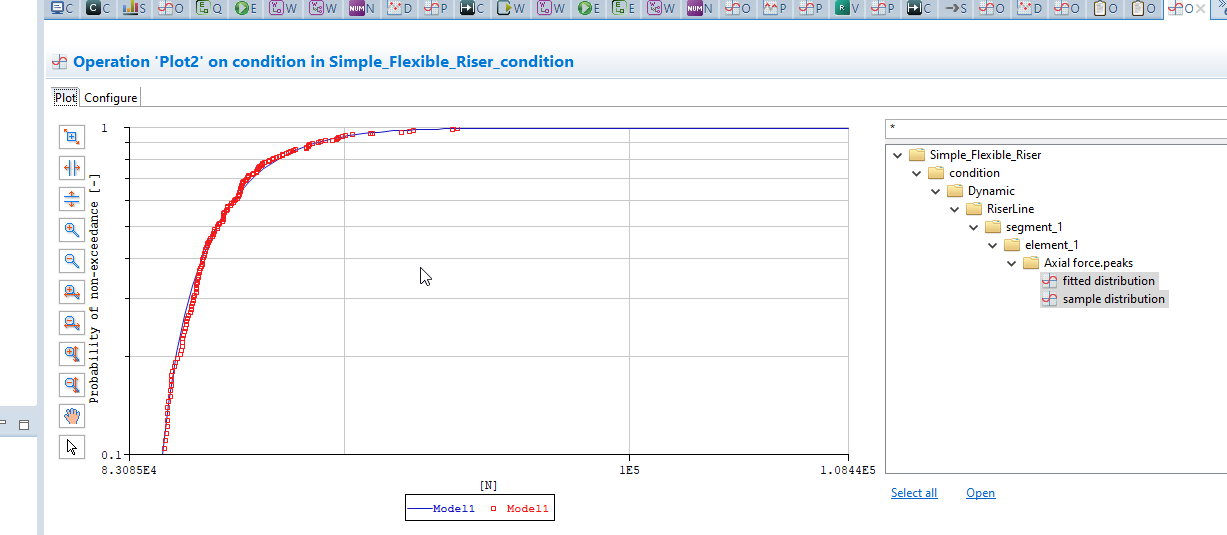
How to make log-log plots 1. Example: Analysis Make a condition in Riflex Run a dynamic analysis Post-process Select a signal Extract the maxima and make a Weibull plot Send the distribution to a plot operator 2. Plot operator 3. Connect plot & rename 4. On Axis → X-axis Axis → Y-axis Tick off Log 5. Notes: Remove the statistics at the bottom of the figure You can do this for all traces in the figuere